
DESIGN
When we join visuals and words, we improve our learning, comprehension, and memory of information. Swoop Media collaborates with you to decipher your thoughts into material others will understand.
What is information design*?
All design, whether graphic or industrial, exists to solve a problem or provide a function, rather than a visual expression
Information design refers to an area of graphic design focused on presenting information in a way that is easier to understand
It commonly includes visual elements such as graphs, charts, and iconography
Why would I use it?
Information presented with poor design or dense text, readers often disregard or ignore
Improving the flow of your data and ideas makes your project easier to understand
You can save time and money when a professional communicator guides you through the design process
*How does Swoop Media use information design? Focusing on information design in the form of layout design (for digital and print).
How can I use information design?

PowerPoints
A well-planned presentation compliments and reinforces your ideas. When you're struggling with your presentation, it's about finding a visually appealing way to relay your message effectively. Supporting visuals can make or break delivery. Have listeners buy-in with powerful design.

Proposals
A good idea is only part of the equation to getting approval, buy-in, or funding. How you present your concepts impacts decision-makers too. Hard to read or uninteresting proposals fall flat. Working with a designer allows you to shape the best way to deliver your pitch.

Reports
Are you trying to create an impact? Highlight a project or findings? Structuring your report with a designer does more than keep you on brand. It helps express data in a way that is easy to read. Skip the templates and get professional help in making your data and design work together.

Infographics
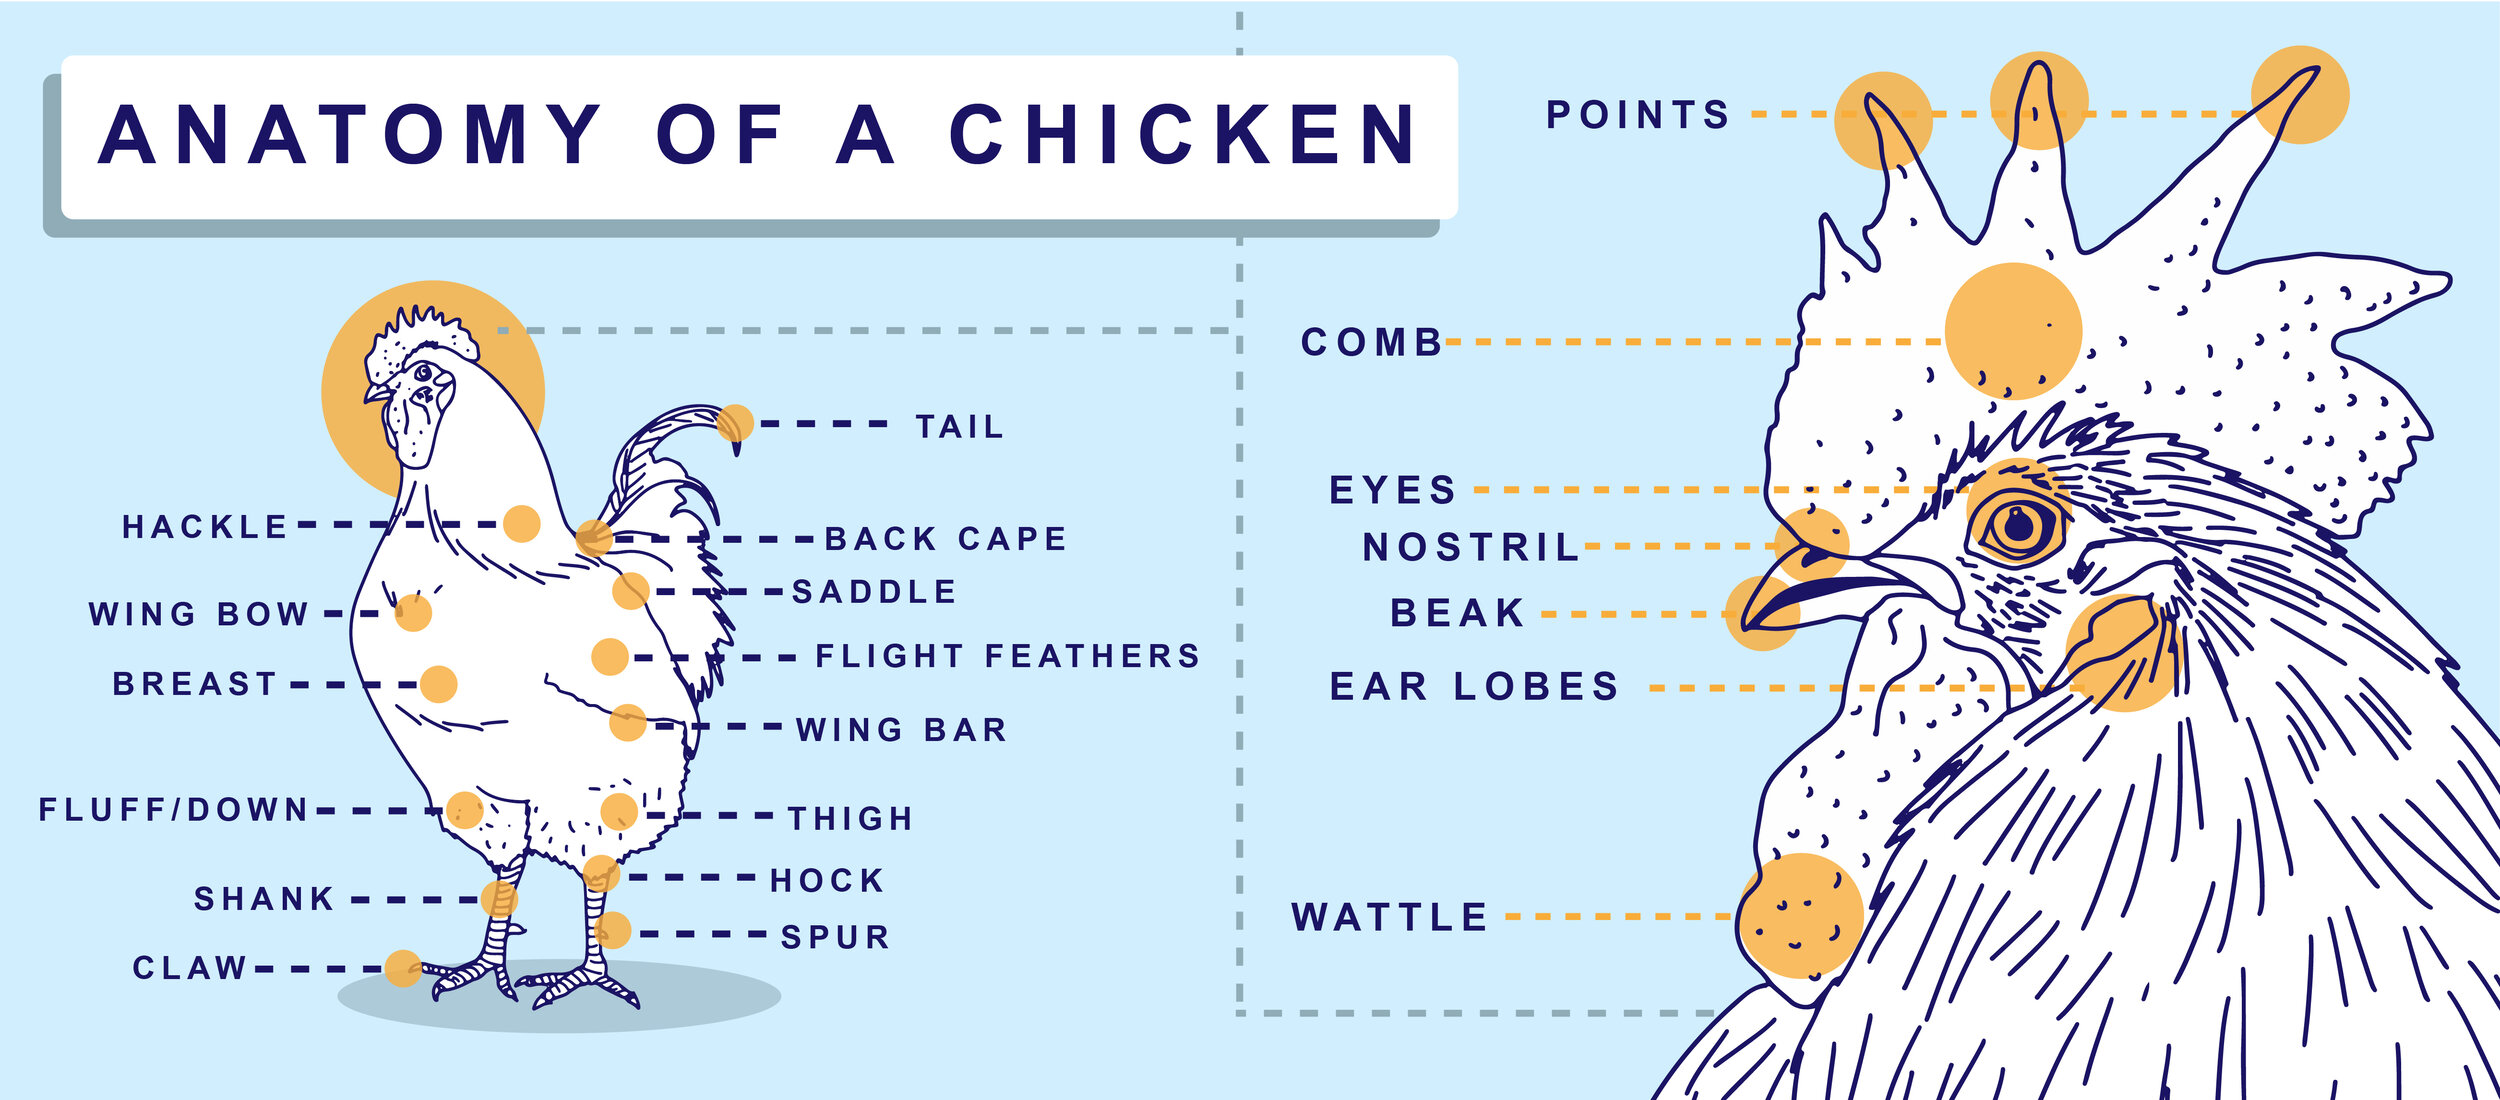
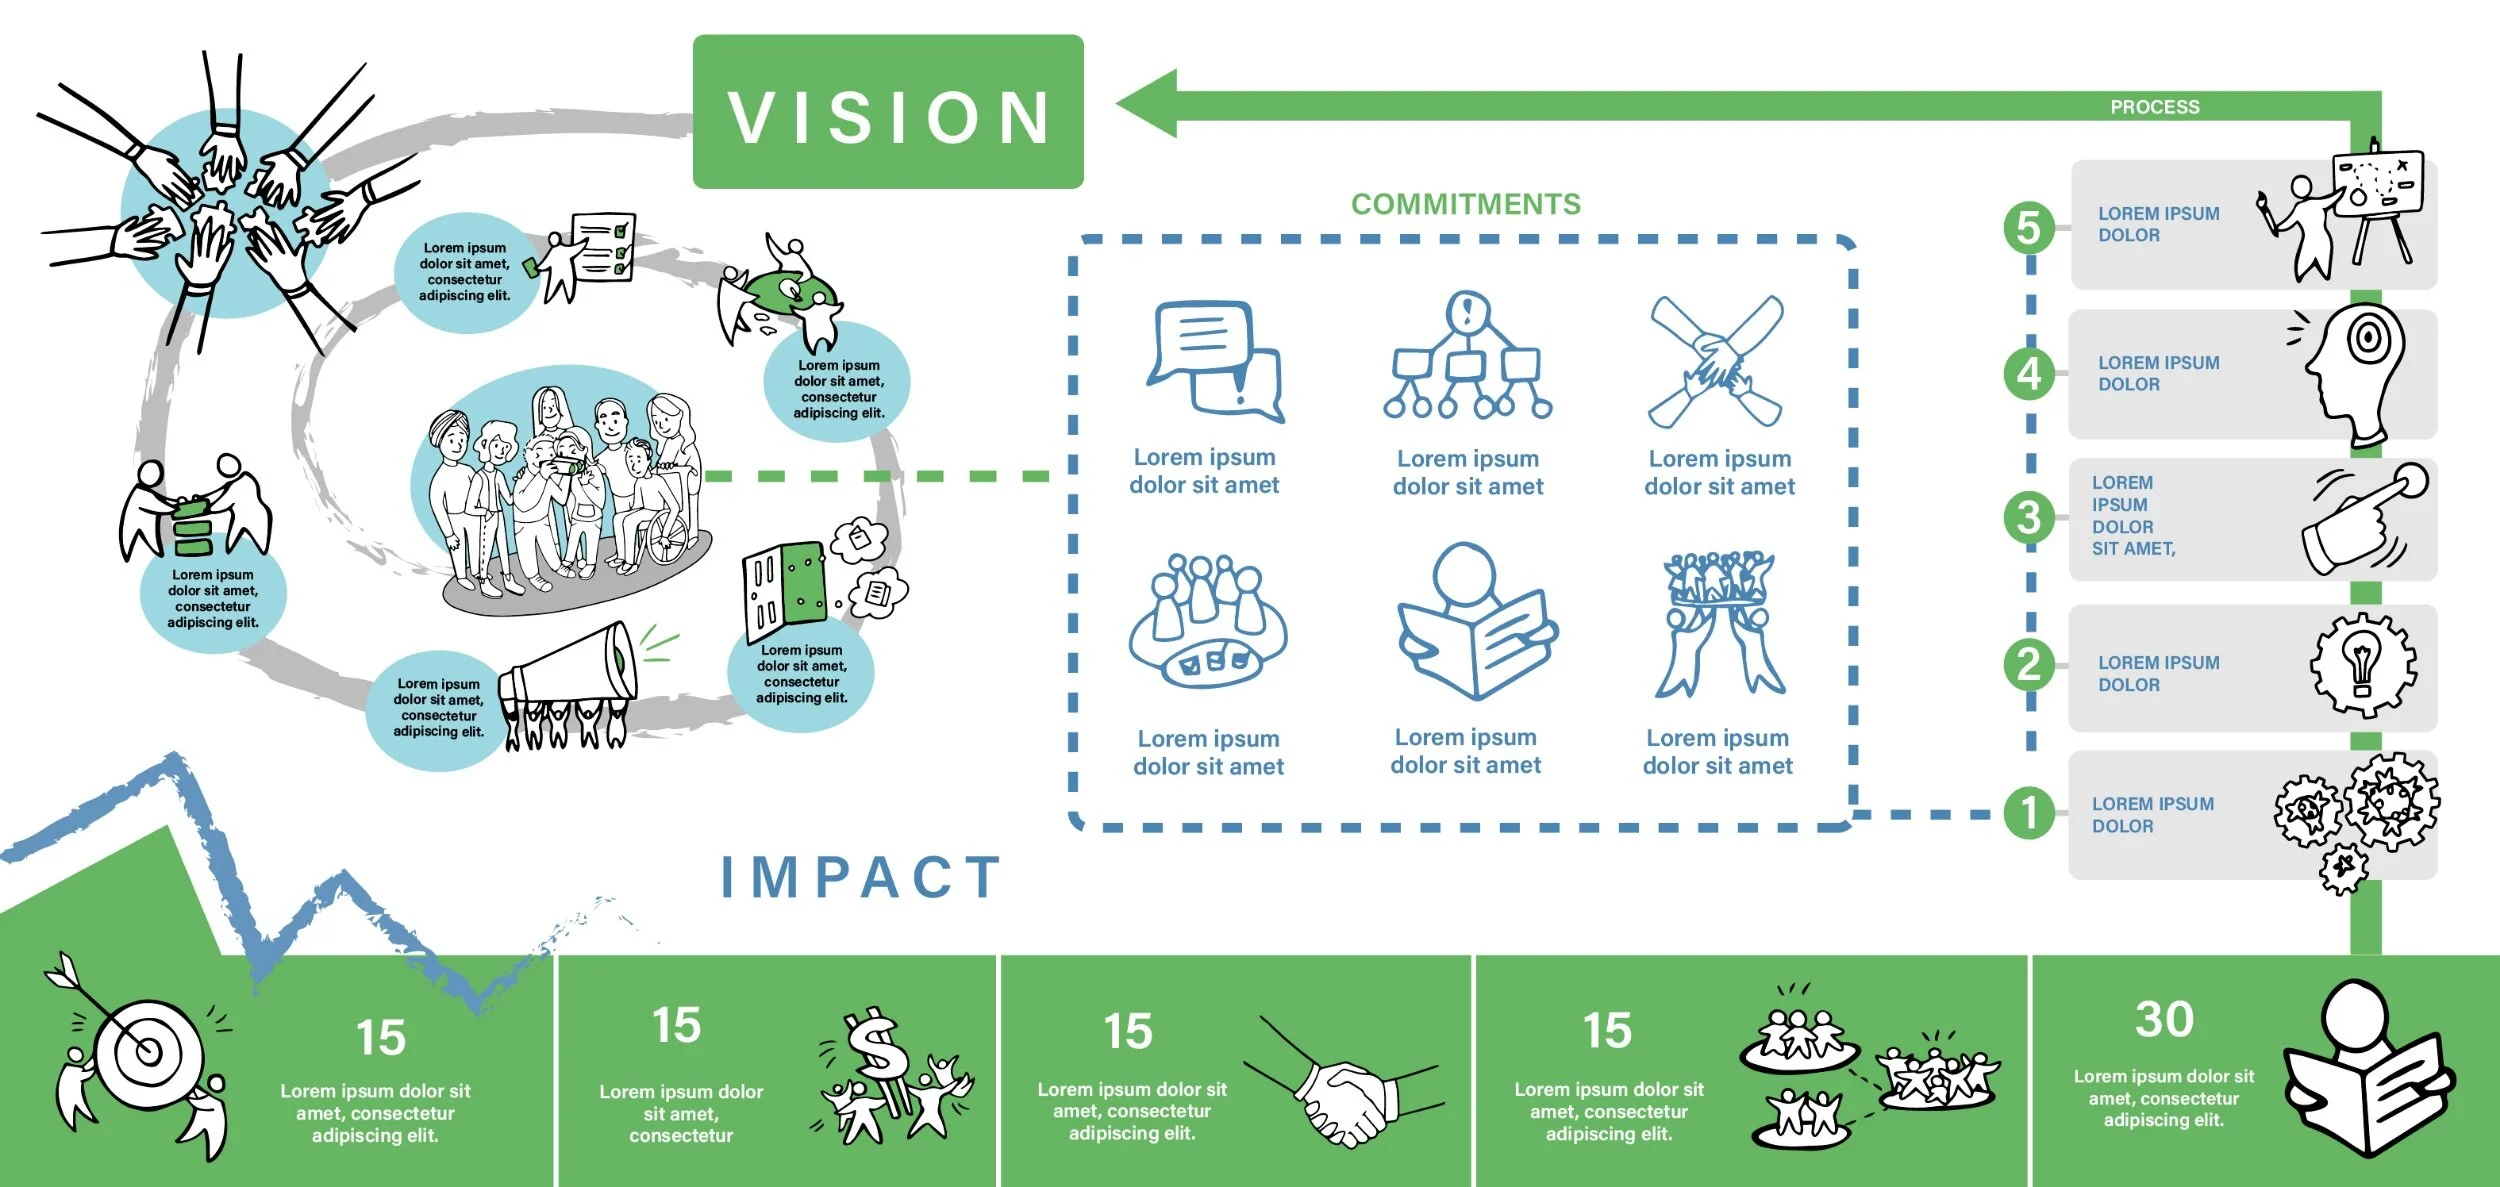
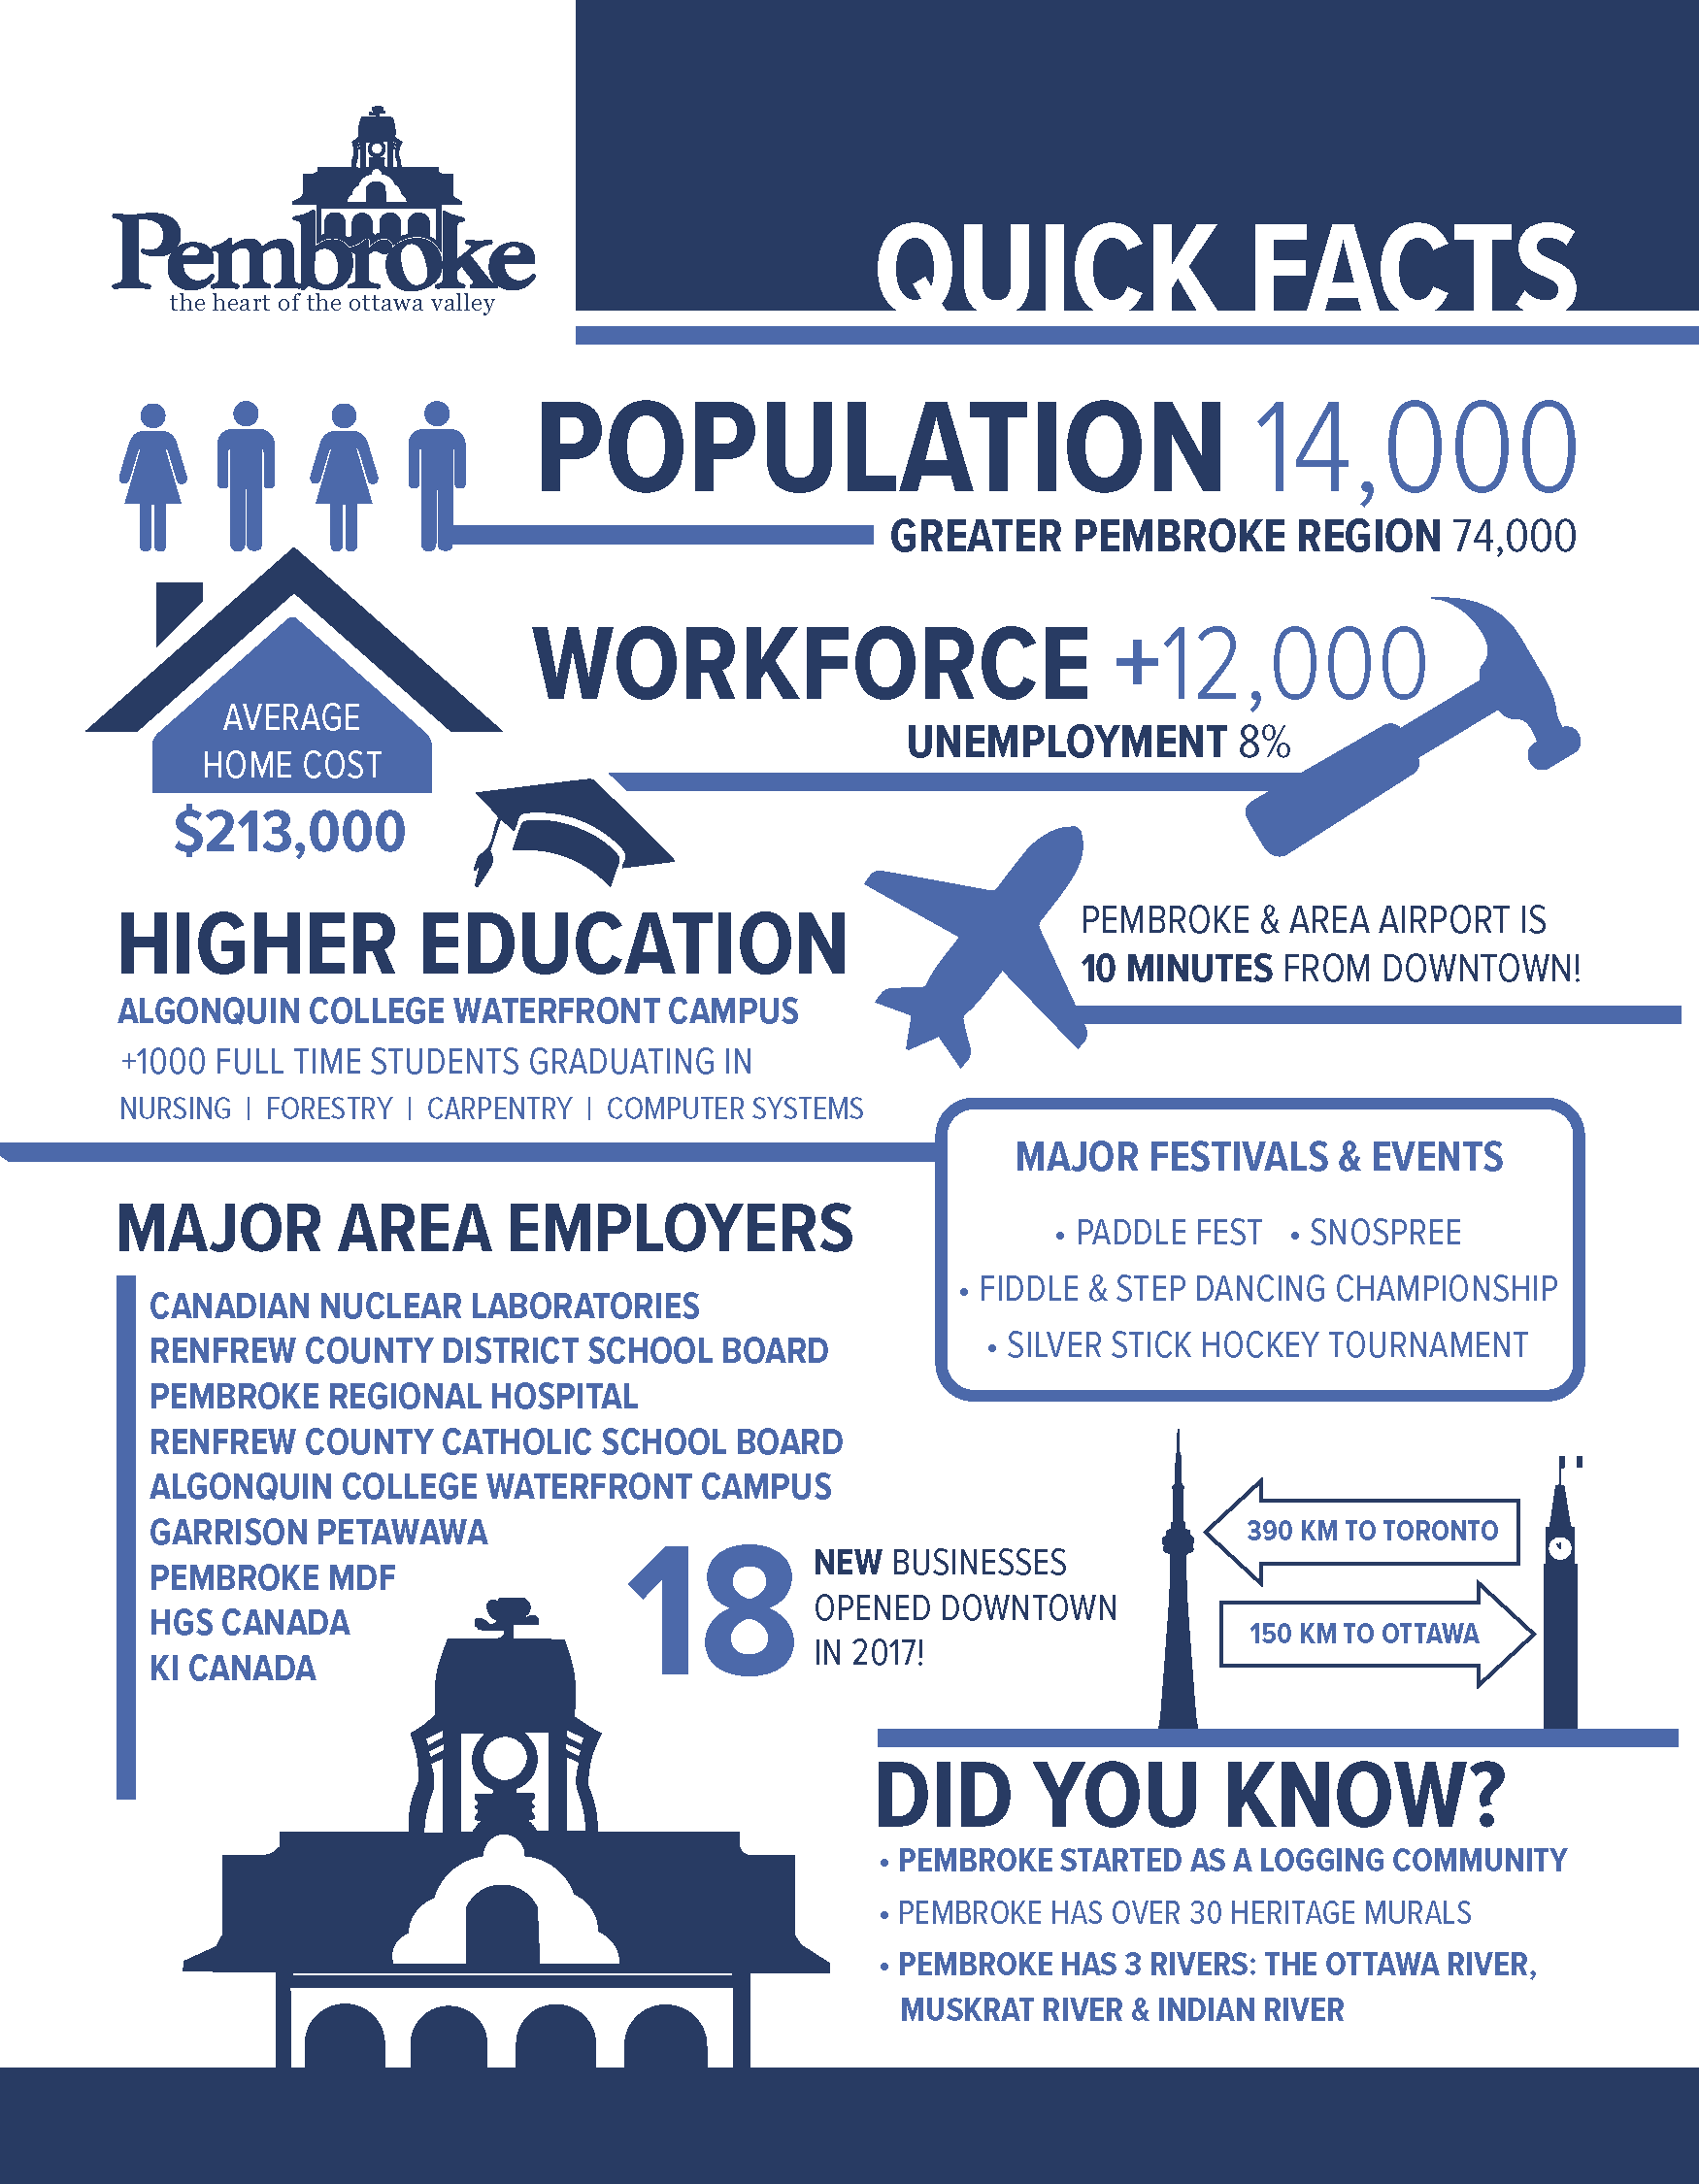
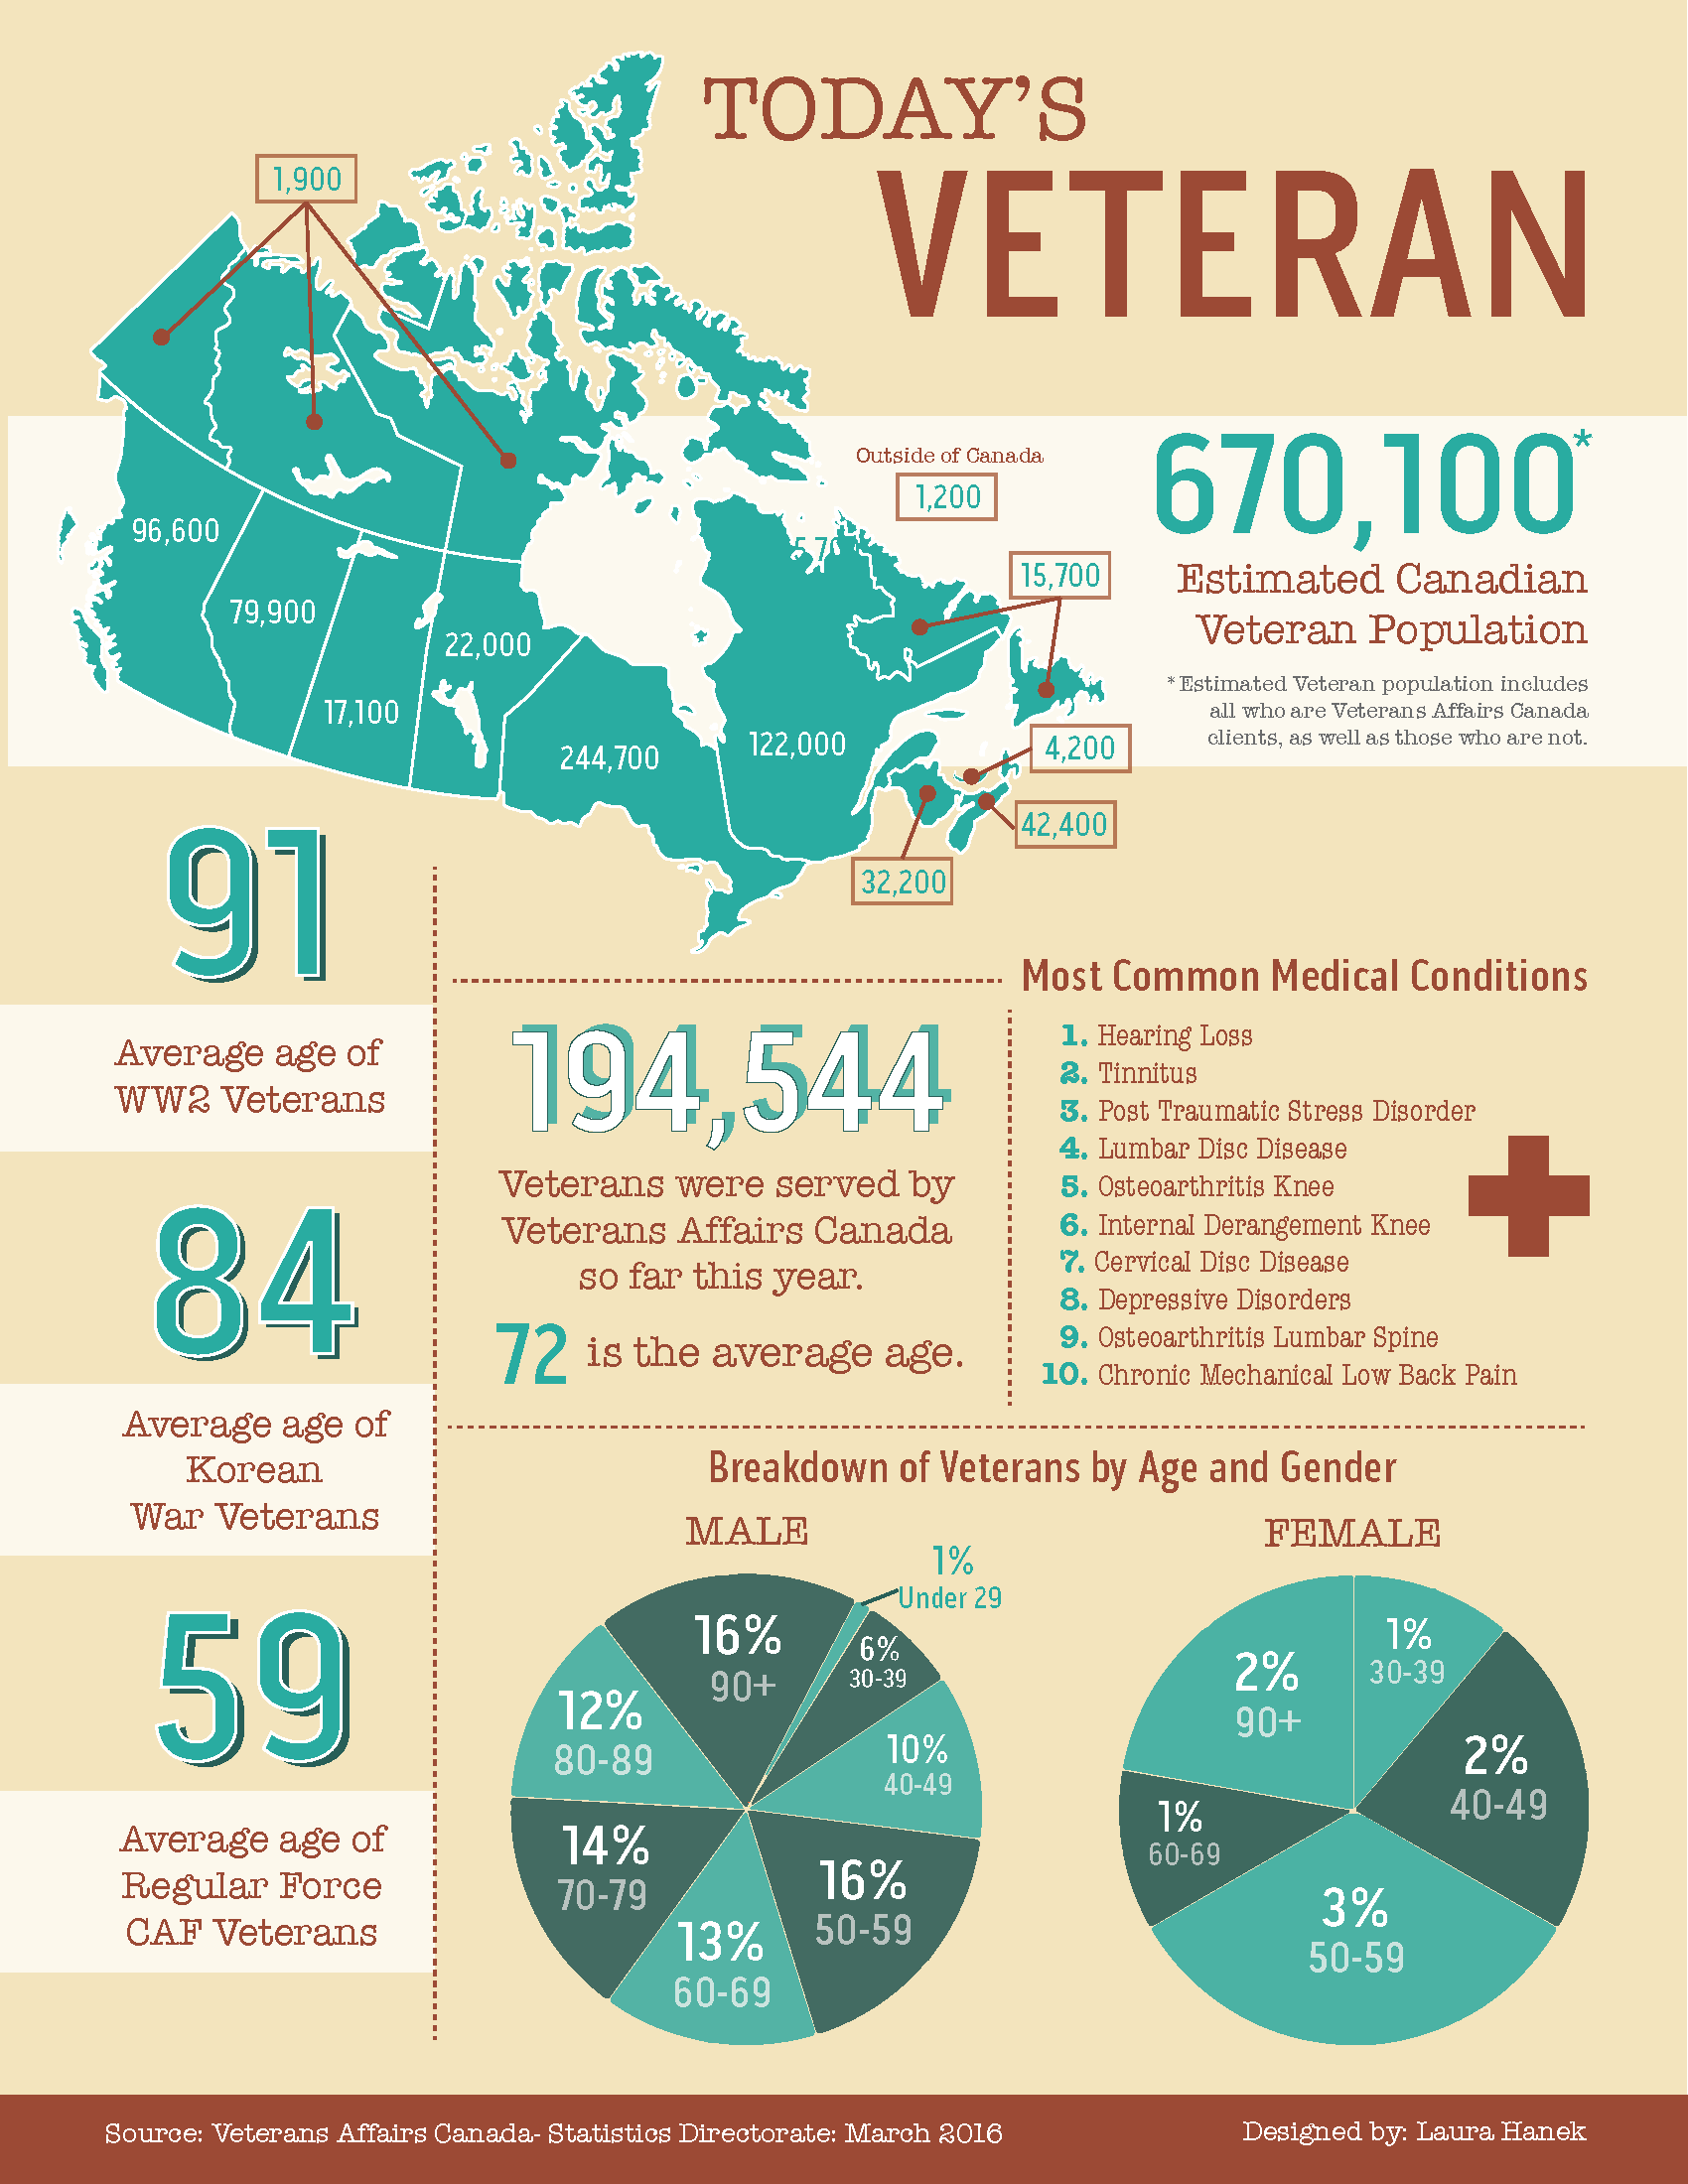
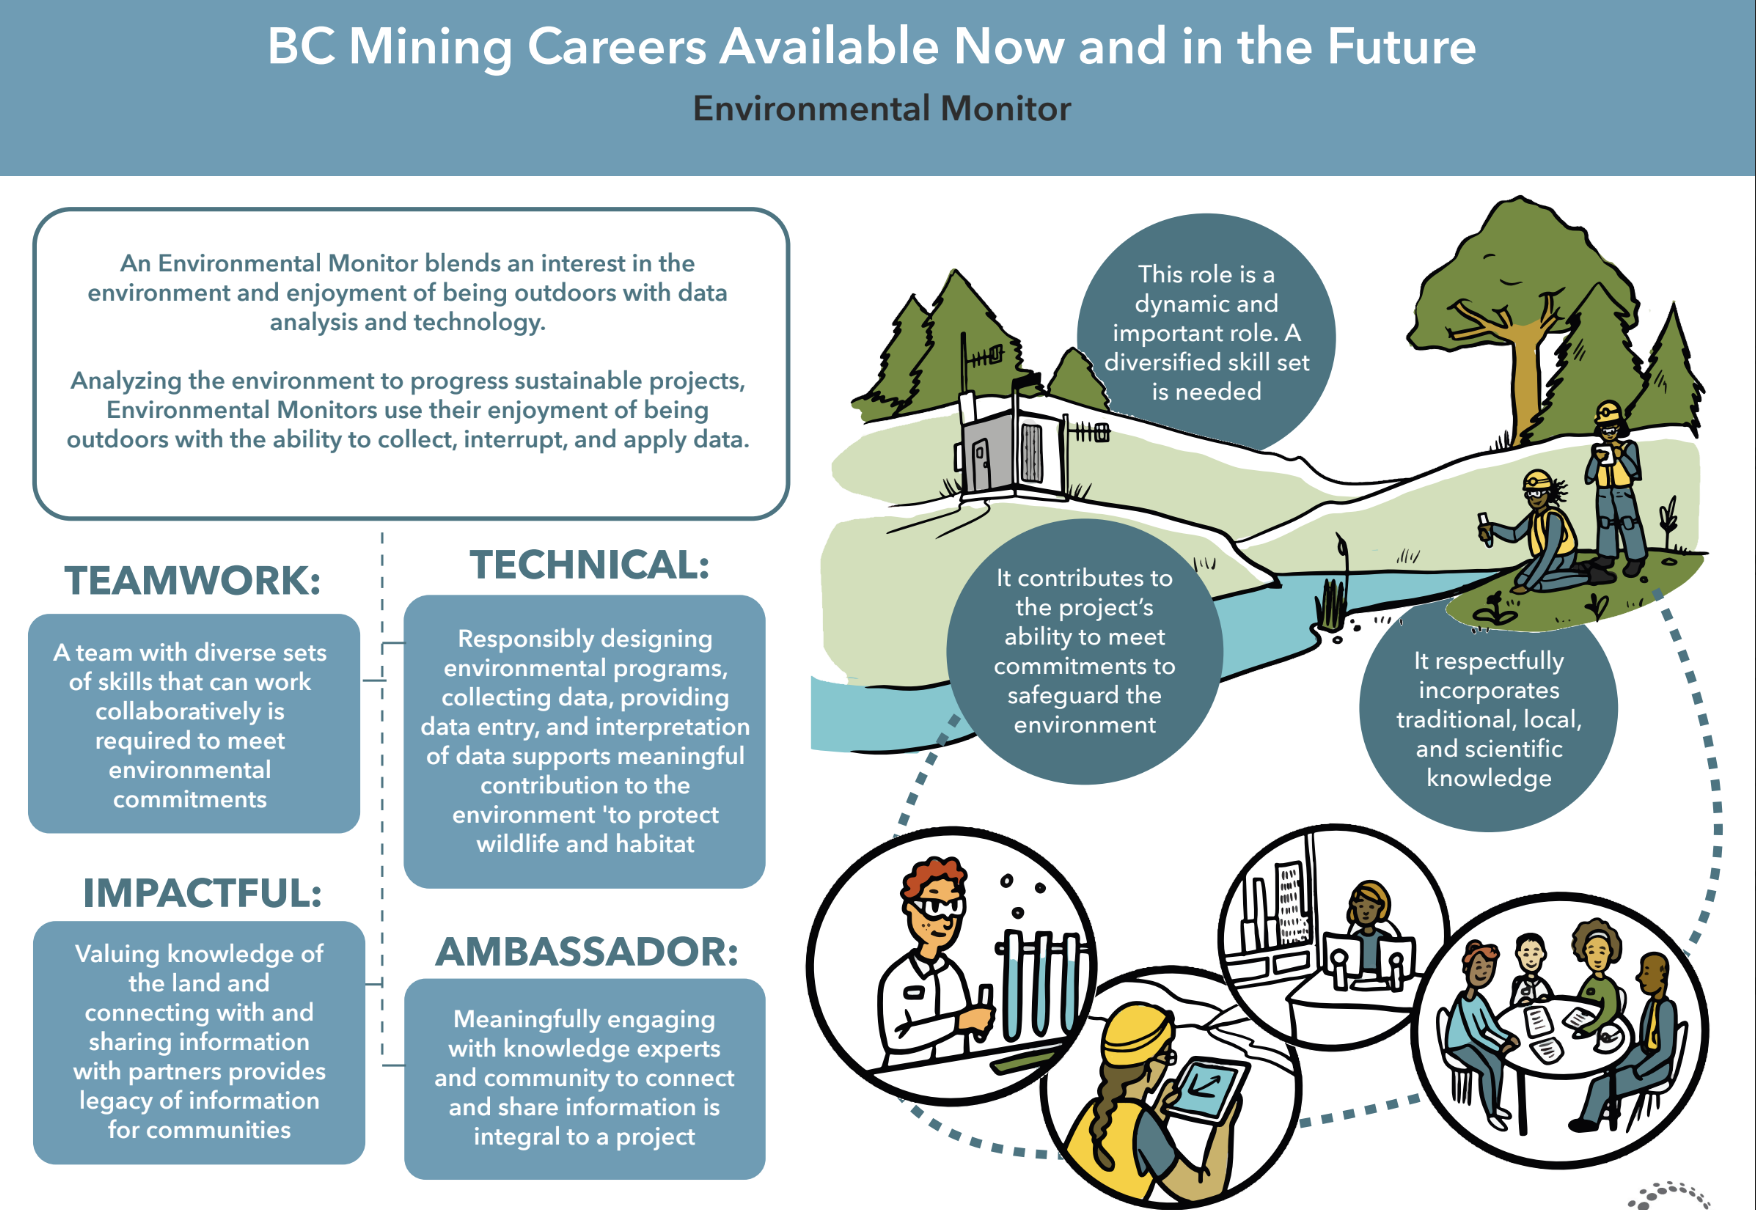
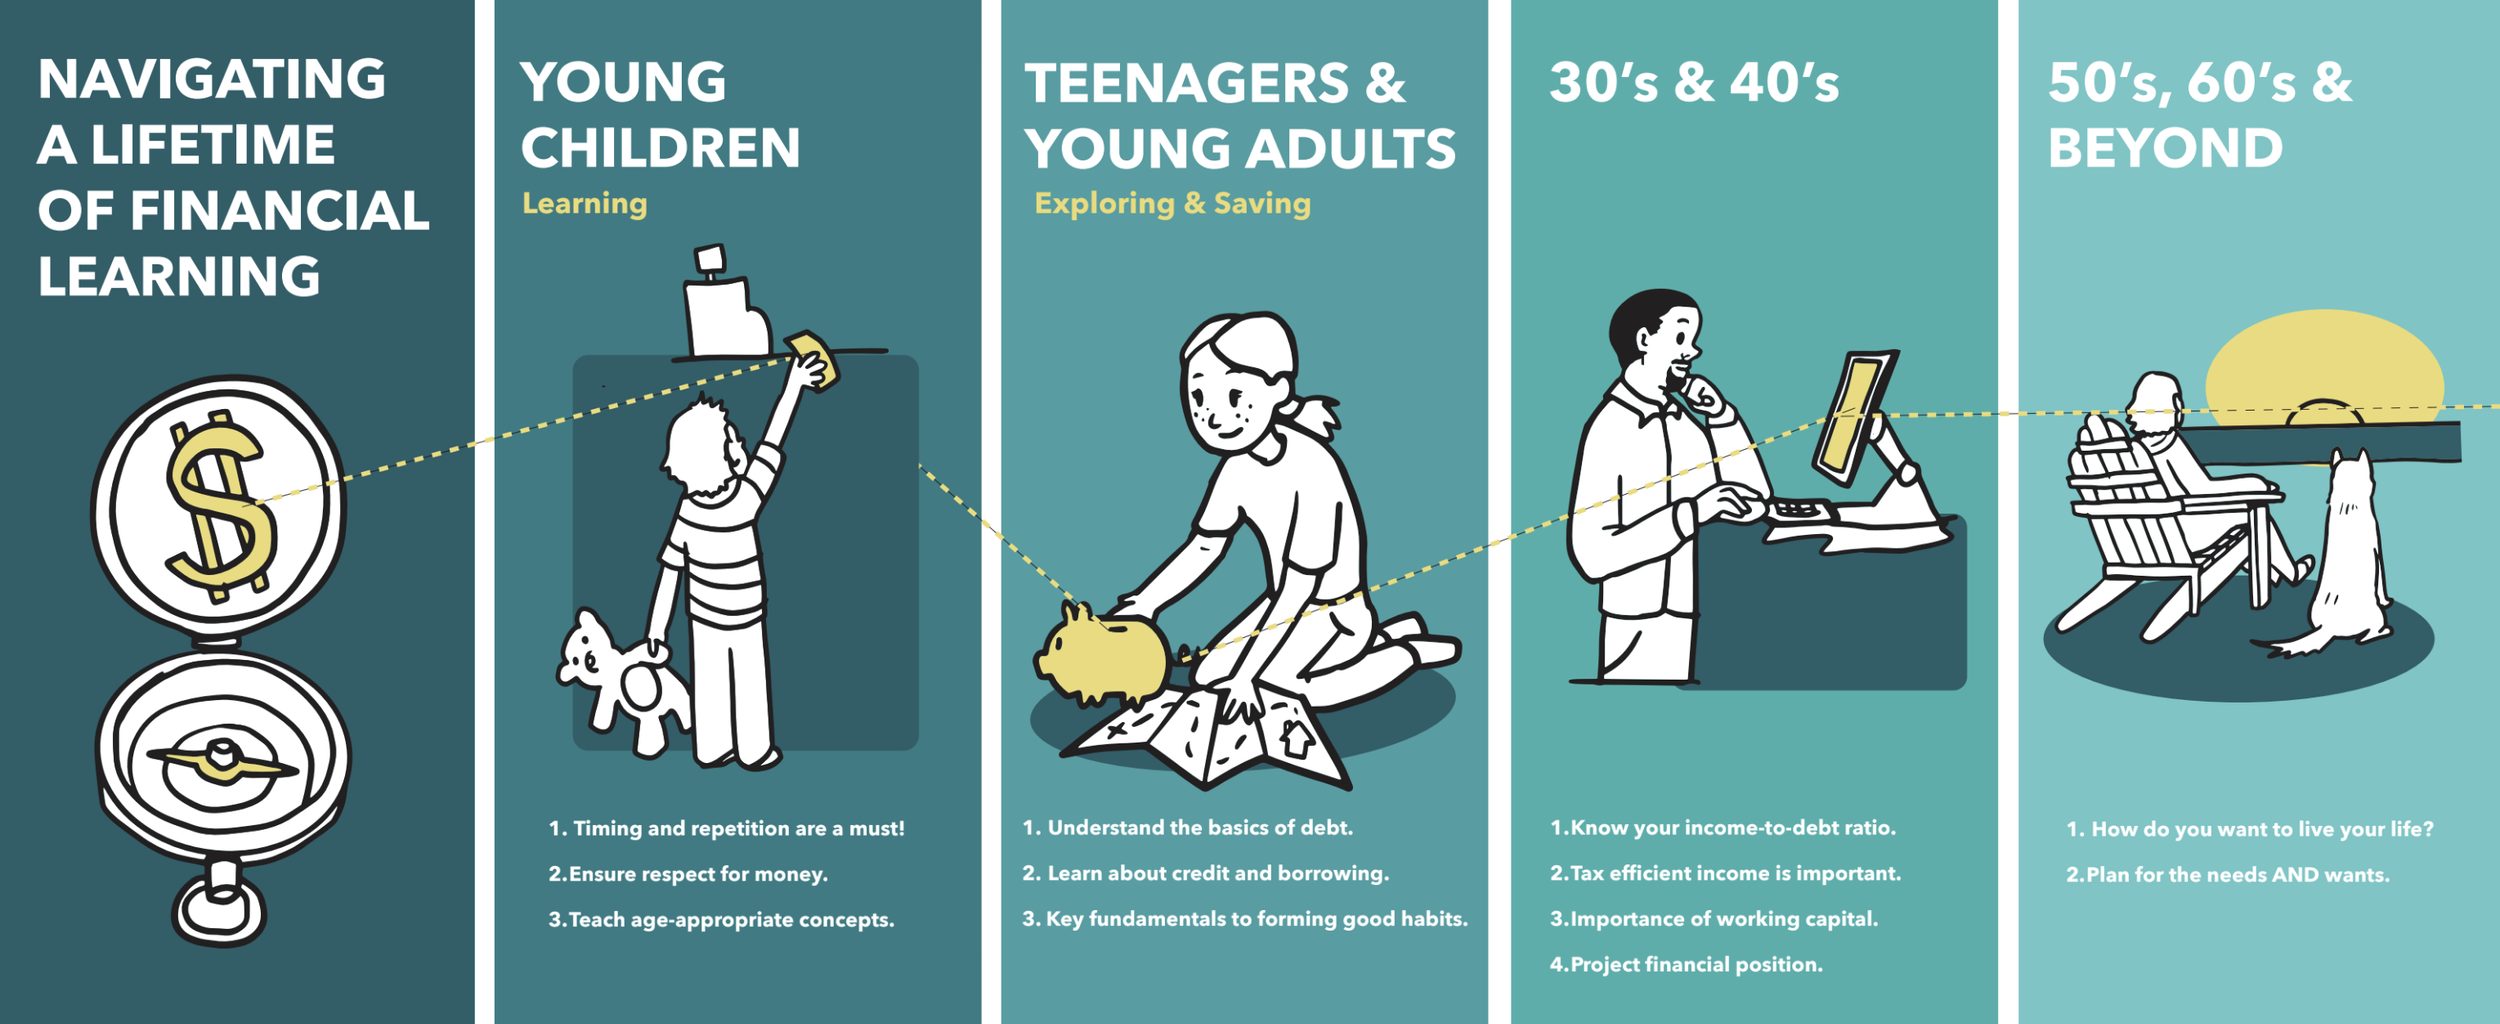
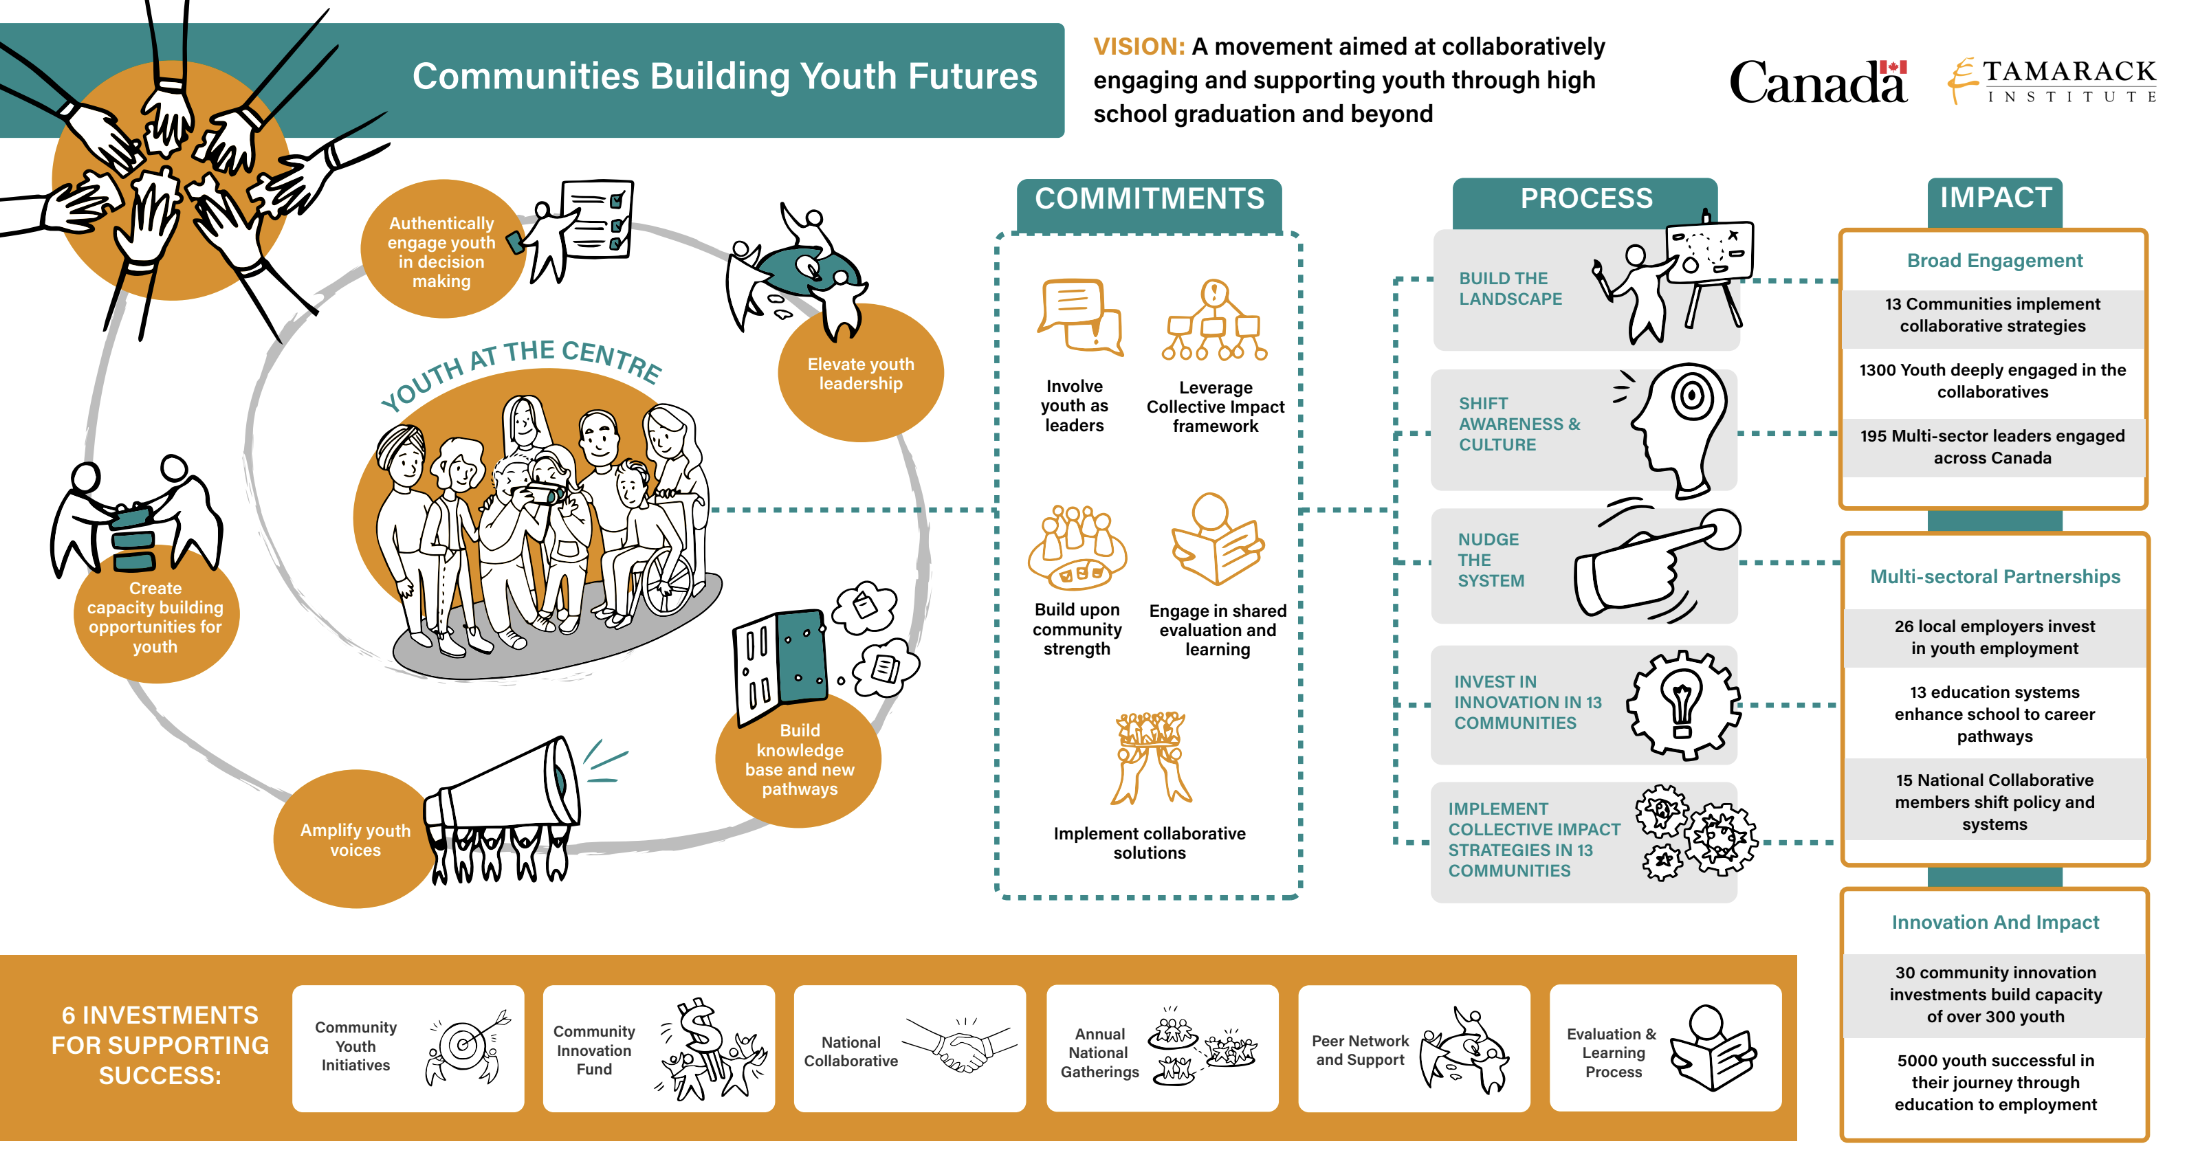
Infographics are visual images, such as a diagram or chart, used to explain or express information. First popular in displaying data, we now use them to illustrate ideas more quickly and clearly than words alone. They can be hand-drawn, computer-generated, or a mix, based on style and budget.
Pricing
Information Design services vary greatly from project to project. Factors that influence your investment include style, complexity, image rights, and timeline. We discuss custom estimates during our discovery call.

“Laura turned my half-baked idea and our scribbles into a beautiful infographic, in short order. She is collaborative, creative and responsive. I will definitely engage Laura in future design work.
— Angela Hoyt, Evolution Group